From Data Analyst to Data Scientist: How to Make the Data Analyst to Data Scientist Career Switch in 2026
Contents
- The Core Evolution: Reporting the News vs. Building the Engine
- Why Working Analysts Have the Advantage
- The Three Essential Bridges
- Bridge 1: The Math Bridge — From Averages to Algorithms
- Bridge 2: The Code Bridge — From Scripting to Engineering
- Bridge 3: The Modelling Bridge — From Describing to Predicting
- The Portfolio Pivot: Reframing What You Have Already Built
- The Reframing Principle
- Upskilling for Data Science 2026: The 6-Month Transition Plan
- Phase 1 — The Math Bridge (Weeks 1–6)
- Phase 2 — The Code Bridge (Weeks 7–14)
- Phase 3 — The Modelling Bridge (Weeks 15–22)
- Phase 4 — Portfolio Pivot and Market Entry (Weeks 23–26)
- The Mumbai Market Outlook: What Waits on the Other Side
- The Most Common Mistakes in the Data Analyst to Data Scientist Career Switch
- Mistake 1: Skipping the Math and Jumping to Libraries
- Mistake 2: Stopping After the Certificate
- Mistake 3: Underselling the Analyst Experience
- Mistake 4: Targeting the Wrong Role Level
- Upskilling for Data Science 2026: Ready to Stop Reporting and Start Building?
There is a moment every working Data Analyst eventually hits. You have mastered SQL. Your Power BI dashboards are clean and executive-ready. You can explain a year-over-year revenue variance to a CFO without breaking a sweat. And then you look at the Data Scientist sitting two desks away — building a model that predicts which customers will churn before the CFO even has a question to ask — and you think: I want to be on that side of the table.
The data analyst to data scientist career switch is one of the most well-trodden, well-supported, and high-return career moves in Mumbai's 2026 tech market. It is not a leap into the unknown — it is a deliberate upgrade of the foundation you already have. And because you are already working inside the data ecosystem, you are starting the transition with advantages that career-switchers from outside the field spend months trying to build.
This guide gives you the honest, practical roadmap: what the switch actually requires, where most analysts get stuck, how to reposition the work you have already done, and what the salary trajectory looks like when you arrive on the other side.

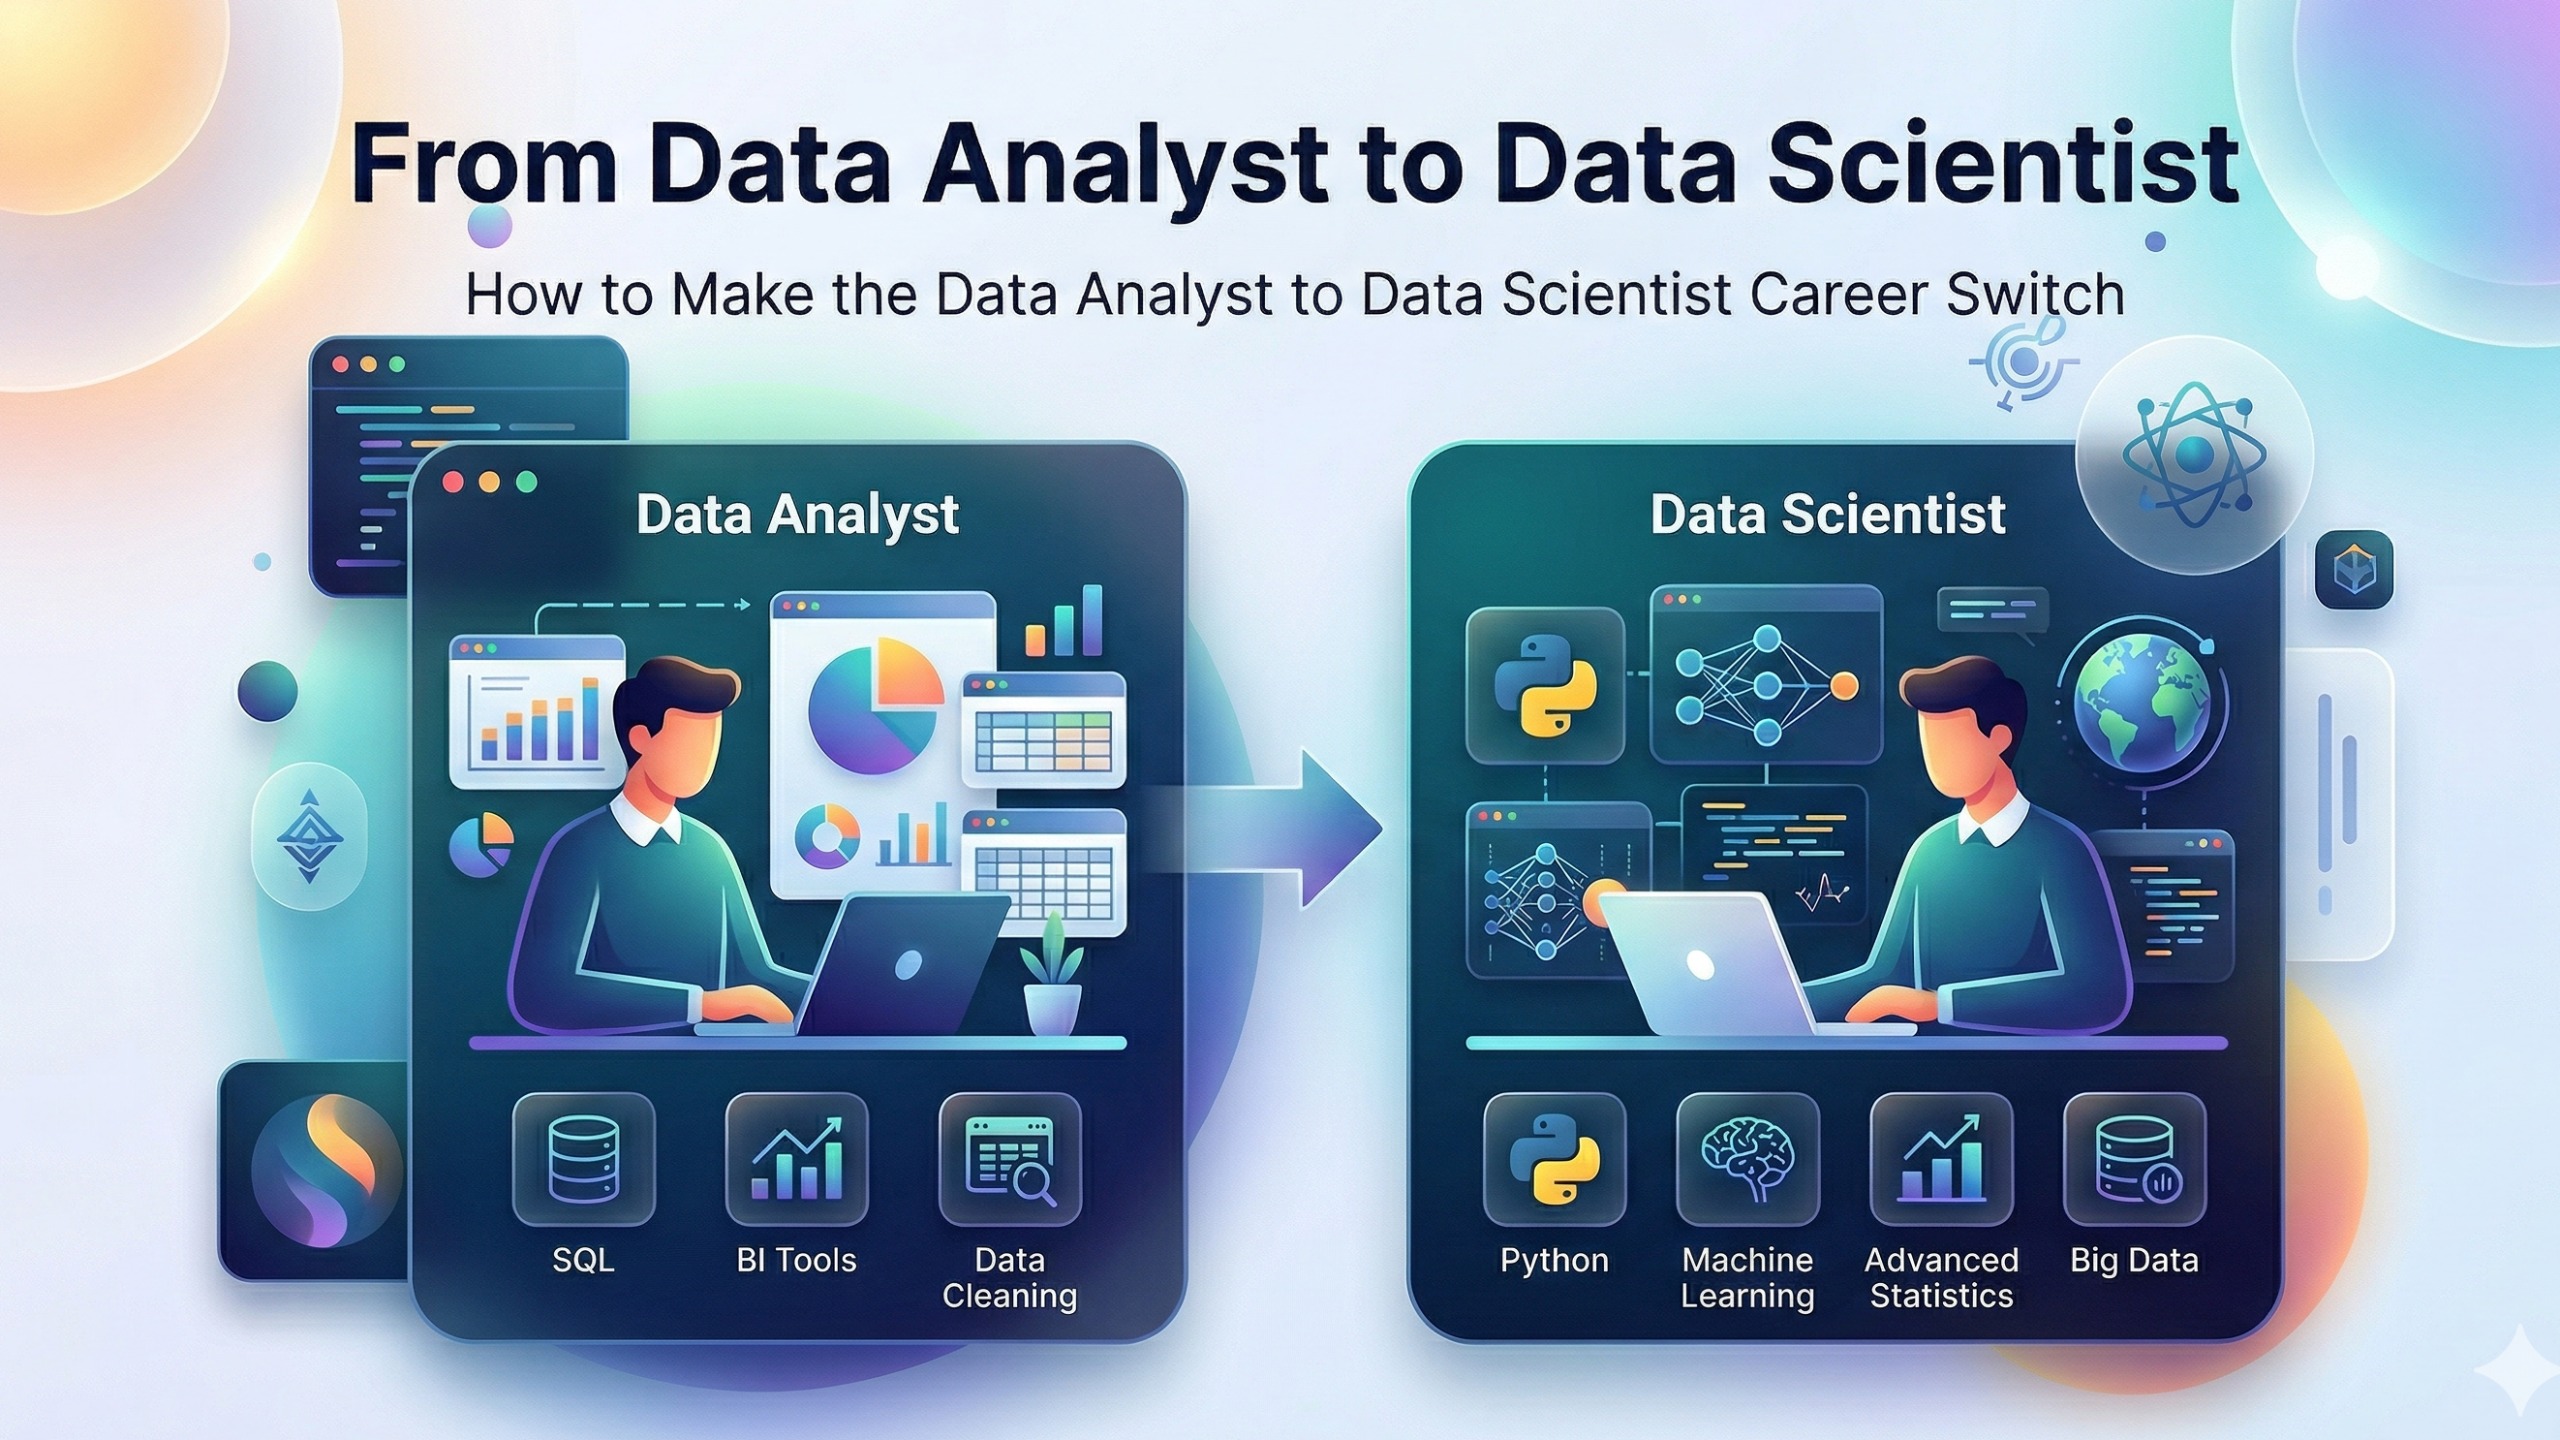
The Core Evolution: Reporting the News vs. Building the Engine
The clearest way to understand the difference between a Data Analyst and a Data Scientist is through what they produce.
A Data Analyst reports the news. They are the professional who looks at what has already happened — last quarter's revenue, last month's churn rate, last week's campaign conversion — and explains it clearly, accurately, and visually. The value is retrospective clarity: the business understands where it has been and why.
A Data Scientist builds the engine. They are the professional who creates a system that looks at current signals and predicts what will happen next — which customers are likely to churn in the next 30 days, which loan applicants are likely to default, which products a given user is most likely to purchase. The value is forward-looking intelligence: the business can act before the event, not after it.
In 2026, the distinction has sharpened further. The most in-demand Data Scientists in Mumbai are not just building predictive models — they are building Agentic AI systems: workflows where an LLM combined with predictive models can observe data, make a decision, take an action, and monitor the result — autonomously, at scale. A churn prediction model that flags at-risk customers is valuable. A churn prediction agent that flags at-risk customers, selects the optimal retention offer for each one based on their profile, triggers the outreach automatically, and logs the outcome for continuous improvement — that is the direction Mumbai's top FinTech and BFSI employers are moving.
The transition you are making is not from a lesser role to a greater one. It is from a reporting discipline to an engineering discipline. The skills, the tools, the mental model, and the output all evolve — which is why the salary bracket evolves with them.
Why Working Analysts Have the Advantage
Before addressing what you need to learn, it is worth being precise about what you already have — because the data analyst to data scientist career switch is genuinely easier from the inside than from the outside.
You understand what "good data" looks like. Every Data Scientist spends a significant proportion of their time on data quality — detecting anomalies, handling missing values, understanding why certain fields are null, tracking down pipeline inconsistencies. You have been living in this problem space for years. You know the difference between a null because the event did not happen and a null because the data collection broke. Junior Data Scientists with no analyst background frequently waste weeks on data issues you would diagnose in an afternoon.
You know what the business actually cares about. A Data Scientist who has never worked as an analyst is prone to a specific failure mode: technically excellent models that answer the wrong question. You know that a 92% accurate model means nothing if the 8% errors are all concentrated in the high-value customer segment. You know that a forecast that is directionally right but systematically biased in one direction will cause inventory disasters. This business judgement is not teachable in a course — it is accumulated through years of stakeholder conversations, and you already have it.
You have domain knowledge that took years to build. If you are a Data Analyst at an HDFC subsidiary in BKC, you understand credit products, customer segments, and the operational metrics that the risk team actually acts on. If you are at Nykaa in Andheri, you understand beauty retail, category management, and what a bad recommendation looks like from a customer experience perspective. This domain context makes your models more useful than those of a technically superior Data Scientist who has to ask basic questions about the business in every meeting.
You have SQL — and SQL is still the foundation. The most consistently undervalued skill in the analyst-to-scientist transition is the deep SQL competency that experienced analysts carry. Feature engineering for ML models is often fundamentally a SQL or pandas problem. Your ability to extract, join, aggregate, and window-function your way to a clean feature matrix is a genuine head start.
| Category | What Data Analysts Already Know | What Data Scientists Need to Learn | Why It Matters |
|---|---|---|---|
| Programming | SQL, basic Python/R (pandas, Excel automation) | Advanced Python (NumPy, SciPy), writing production-level code | Enables building scalable data models and pipelines |
| Statistics | Descriptive stats, basic hypothesis testing | Inferential statistics, probability theory, Bayesian thinking | Required for building reliable predictive models |
| Machine Learning | Basic understanding (sometimes none) | Supervised & Unsupervised ML (Regression, Classification, Clustering) | Core skill for becoming a Data Scientist |
| Data Handling | Excel, SQL databases | Big Data tools (Spark, Hadoop), data pipelines | Needed to work with large-scale datasets |
| Visualization | Tableau, Power BI, charts in Excel | Advanced storytelling, Matplotlib, Seaborn, Plotly | Communicating complex insights effectively |
| Mathematics | Basic algebra, averages | Linear algebra, calculus fundamentals | Helps understand how ML algorithms actually work |
| Business Thinking | Reporting, dashboards, KPIs | Problem framing, experimentation, product thinking | Data Scientists solve business problems, not just report them |
| Model Deployment | Not required | APIs, Flask/FastAPI, cloud deployment | Turning models into real-world applications |
| Tools & Ecosystem | Excel, SQL, BI tools | Git, Docker, cloud platforms (AWS, GCP) | Essential for collaboration and production workflows |
| AI/Deep Learning | Rare exposure | Neural networks, NLP, deep learning basics | Increasingly in demand in modern data roles |
The Three Essential Bridges
The skills gap between a Data Analyst and a Data Scientist is real but finite. It is organised around three bridges — each one a translation of something you already understand into a deeper, more engineered form.
Bridge 1: The Math Bridge — From Averages to Algorithms
This is the bridge most analysts dread and most tutorials handle badly. The dread is understandable: "linear algebra" and "calculus" sound like university nightmares. The tutorial failure is worse: most resources either skip the math entirely ("just call model.fit() and trust the library") or go so deep into theory that the practical application is lost.
The goal is neither. The goal is intuitive mathematical literacy — understanding why an algorithm works the way it does well enough to diagnose it when it behaves unexpectedly, choose the right algorithm for a given problem, and explain a model's behaviour to a business stakeholder. You do not need to derive the backpropagation algorithm from scratch. You do need to understand what it is doing and why the learning rate matters.
Linear Algebra: The Language of Tabular Data
Every dataset you have ever worked with is a matrix — rows of observations, columns of features. Every ML operation — computing distances, transforming features, multiplying weights — is a linear algebra operation. Understanding the intuition behind vectors, dot products, matrix multiplication, and eigenvalues is not academic for a Data Scientist. It is the lens through which every model and every dataset is understood.
From analyst intuition to scientist intuition:
| Analyst Mental Model | Data Scientist Mental Model |
|---|---|
| "These two columns are correlated" | "The angle between these two feature vectors is small — their dot product is high" |
| "I'm applying a standardisation formula to this column" | "I'm centering and scaling each feature dimension so the distance metric is not dominated by large-magnitude variables" |
| "This PCA plot shows two clusters" | "These are the first two principal components — the directions of maximum variance in the feature space" |
Calculus: Understanding How Models Learn
The specific calculus a Data Scientist needs is narrower than a full course: partial derivatives and the chain rule as they apply to gradient descent. This is the mathematical process by which every ML model adjusts its parameters during training — moving in the direction that reduces the loss function, step by step, iteration by iteration.
Understanding gradient descent at an intuitive level — that you are walking downhill on an error surface, that the learning rate controls your step size, that a high learning rate overshoots the minimum and a low one takes forever to reach it — allows you to diagnose training instability, choose appropriate learning rates, and understand why your model's training loss is oscillating rather than converging.
You do not need to compute partial derivatives by hand. You need to understand what they represent and why they drive the update rules that model.fit() executes on your behalf.
Statistical Inference: From Describing to Deciding
As an analyst, you use statistics descriptively: means, medians, standard deviations, correlation coefficients. As a Data Scientist, you use statistics inferentially: designing experiments that produce reliable conclusions, interpreting model evaluation metrics in the context of sampling uncertainty, and making statistically defensible claims about model performance.
The specific statistical concepts that matter most for the transition:
- Probability distributions: Understanding that your target variable has a distribution — and that choosing the wrong model family for that distribution (using linear regression for a binary outcome, for example) produces systematically wrong predictions
- Hypothesis testing for model evaluation: Understanding that a 2% improvement in AUC on a test set might not be statistically significant, and knowing how to test whether it is
- The bias-variance trade-off: The mathematical trade-off between underfitting (high bias, model is too simple) and overfitting (high variance, model memorises training data but generalises poorly) — the central tension in all of ML model development
- Bayesian thinking: Updating your beliefs about a model's performance as you accumulate more evidence — the conceptual foundation of Bayesian optimisation for hyperparameter tuning and probabilistic predictions that include confidence intervals
Learning approach: 6–8 weeks, 1–2 hours daily. Khan Academy's Linear Algebra and Statistics courses, 3Blue1Brown's "Essence of Linear Algebra" series, and the first two chapters of "An Introduction to Statistical Learning" (freely available online) cover this material at exactly the right depth for this transition.
Bridge 2: The Code Bridge — From Scripting to Engineering
You can already write Python. You use it for pandas, for quick data cleaning scripts, for automating a report refresh. That is scripting — code as a tool for individual analytical tasks. Data Science requires engineering — code as a structured system that other people can read, test, extend, and run reliably in production.
This is not just a style preference. It is a professional requirement. A Data Scientist who hands off a model as a 600-line notebook with hardcoded file paths, no docstrings, and no test coverage is not deployable. Their models sit on their laptops. The engineers who build Object-Oriented, modular, testable code ship models that work in production — and get paid accordingly.
Object-Oriented Programming: Thinking in Systems, Not Scripts
The core shift from scripting to engineering is the move from writing a sequence of steps to building a system of interacting components. Object-Oriented Programming (OOP) — classes, methods, inheritance, encapsulation — is the primary tool for this.
The scripting approach (how analysts typically write Python):
# analysis.py — the typical analyst script
import pandas as pd

df = pd.read_csv("customer_data.csv")
df['churn_risk'] = df['days_since_last_purchase'].apply(
    lambda x: 'HIGH' if x > 90 else 'LOW'
)
df.to_csv("output.csv")
The engineering approach (what a Data Scientist needs to write):
# churn_model.py — the engineering equivalent
import pandas as pd
from sklearn.base import BaseEstimator, TransformerMixin

class ChurnRiskClassifier(BaseEstimator, TransformerMixin):
    """
    Classifies customers into churn risk tiers based on behavioural features.

    Parameters
    ----------
    high_risk_threshold : int
        Days since last purchase above which a customer is HIGH risk.
    medium_risk_threshold : int
        Days since last purchase above which a customer is MEDIUM risk.
    """

    def __init__(self, high_risk_threshold: int = 90, medium_risk_threshold: int = 30):
        self.high_risk_threshold = high_risk_threshold
        self.medium_risk_threshold = medium_risk_threshold

    def fit(self, X: pd.DataFrame, y=None):
        # Learn any parameters from training data if needed
        return self

    def predict(self, X: pd.DataFrame) -> pd.Series:
        conditions = [
            X['days_since_last_purchase'] > self.high_risk_threshold,
            X['days_since_last_purchase'] > self.medium_risk_threshold
        ]
        return pd.Series(
            pd.np.select(conditions, ['HIGH', 'MEDIUM'], default='LOW'),
            index=X.index
        )

    def predict_proba(self, X: pd.DataFrame) -> pd.DataFrame:
        # Returns probability estimates for pipeline compatibility
        raw = X['days_since_last_purchase'] / (self.high_risk_threshold * 1.5)
        return pd.DataFrame({
            'LOW': 1 - raw.clip(0, 1),
            'HIGH': raw.clip(0, 1)
        })
The second version is longer. It is also testable, reusable, compatible with scikit-learn's Pipeline API, and deployable by an engineer who has never spoken to the data scientist who wrote it.
The Scikit-Learn Ecosystem: The Analyst's Gateway to ML Engineering
Scikit-learn is the bridge between your existing Python knowledge and production-grade ML engineering. Its design philosophy — consistent fit(), transform(), predict() interfaces across all estimators — teaches good ML engineering habits naturally.
The specific scikit-learn concepts that mark the analyst-to-scientist transition:
- Pipelines: Chaining preprocessing and model steps so that train and serving transformations are always applied identically — eliminating the training-serving skew problem
- ColumnTransformer: Applying different transformations to different feature types (numerical scaling, categorical encoding, text vectorisation) in a single, reproducible pipeline step
- Cross-validation strategies:
StratifiedKFoldfor imbalanced classification,TimeSeriesSplitfor sequential data, andGroupKFoldfor grouped data — knowing which strategy is appropriate for your specific problem is a professional differentiator - Custom estimators: Writing classes that inherit from
BaseEstimatorandTransformerMixinto encapsulate domain-specific feature engineering logic — the code pattern shown above
PyTorch: The Foundation of Modern Deep Learning
For the analyst targeting Data Science roles that include Deep Learning or GenAI work — which is increasingly all of them at FinTech and BFSI firms — PyTorch is the framework. It is the platform on which most modern LLMs are built, on which fine-tuning experiments are run, and on which custom neural architectures are prototyped.
The PyTorch concepts to build for this transition:
- Tensors: PyTorch's fundamental data structure — a multi-dimensional array that can live on a GPU. Understanding tensor operations is the gateway to understanding neural network computations.
nn.Moduleand neural network construction: Defining a neural network as a class, specifying layers in__init__, defining the forward pass inforward()— the structural equivalent of scikit-learn'sBaseEstimator- Training loops: The explicit
optimizer.zero_grad()→loss.backward()→optimizer.step()cycle that PyTorch makes visible, rather than hiding insidemodel.fit(). Understanding this cycle is what allows you to debug training instability, implement custom loss functions, and modify training procedures for specific problems. - Using pre-trained Transformers via HuggingFace: For the overwhelming majority of NLP and LLM-adjacent Data Science work, you will not be training Transformer models from scratch. You will be loading a pre-trained model from HuggingFace, fine-tuning it on domain-specific data, and evaluating the result. This workflow is PyTorch-based and is the gateway to LLM fine-tuning.
Bridge 3: The Modelling Bridge — From Describing to Predicting
This is the bridge most analysts are most excited about — and where the gap is smaller than they expect, because the core analytical instincts (which features matter, how to evaluate whether a model is actually working, how to communicate findings clearly) carry over directly.
From Descriptive Charts to Supervised Learning
Supervised learning — the most common type of ML in Mumbai's BFSI and FinTech applications — is conceptually an extension of the regression and correlation analysis you already do. The difference is in the direction of travel: instead of explaining the relationship between features and an outcome, you are exploiting that relationship to make predictions on new data.
The supervised learning algorithm family every Data Scientist in Mumbai's market needs to know:
| Algorithm | Best For | Common Mumbai Application |
|---|---|---|
| Logistic Regression | Binary classification baseline | Credit default: approve/reject |
| Decision Tree | Interpretable rules, baseline model | Insurance underwriting rule extraction |
| Random Forest | Robust tabular classification/regression | Customer churn, fraud detection |
| Gradient Boosting (XGBoost/LightGBM) | Highest accuracy on tabular data | Credit scoring, demand forecasting |
| Support Vector Machine | High-dimensional classification | Text classification, anomaly detection |
| Linear/Ridge Regression | Continuous target prediction | Revenue forecasting, price prediction |
From Pivot Tables to Unsupervised Learning
As an analyst, you have probably used pivot tables and manual segmentation to group customers. Unsupervised learning does this statistically, at scale, without predefined categories:
- K-means clustering: Segmenting customers into behavioural groups based on RFM (Recency, Frequency, Monetary) features — discovering segments the business did not know existed
- DBSCAN: Density-based clustering that identifies unusual patterns in transaction data — the unsupervised foundation of many anomaly detection systems
- PCA (Principal Component Analysis): Reducing hundreds of correlated features into a smaller set of uncorrelated components that capture the maximum variance — the standard preprocessing step for high-dimensional financial datasets
- Autoencoders: Neural networks that learn compressed representations of data — powerful for anomaly detection in network transactions and behavioural fraud patterns
LLM Fine-Tuning: The Frontier Skill for Mumbai's 2026 Market
The most forward-looking addition to the modelling skill set — and the one commanding the largest salary premium in Mumbai's 2026 data science market — is the ability to fine-tune pre-trained Large Language Models on domain-specific data.
Fine-tuning in the BFSI context means taking a foundation model (Llama, Mistral, Gemma, or a domain-specific financial LLM like Bloomberg GPT) and adapting it to your organisation's specific vocabulary, document types, and tasks — while keeping the general language understanding the foundation model provides.
The practical fine-tuning workflow for most BFSI use cases:
# Fine-tuning a small model for financial sentiment classification
# using LoRA (Low-Rank Adaptation) — the parameter-efficient method
# used in most production fine-tuning scenarios

from transformers import AutoModelForSequenceClassification, AutoTokenizer
from peft import LoraConfig, get_peft_model, TaskType
import torch

# Load a pre-trained model
model_name = "mistralai/Mistral-7B-v0.1"
tokenizer = AutoTokenizer.from_pretrained(model_name)
model = AutoModelForSequenceClassification.from_pretrained(
    model_name,
    num_labels=3,  # Positive / Neutral / Negative sentiment
    torch_dtype=torch.float16
)

# Apply LoRA — fine-tune only a small fraction of parameters
# rather than the full 7 billion
lora_config = LoraConfig(
    task_type=TaskType.SEQ_CLS,
    r=16,                    # LoRA rank — controls capacity of fine-tuning
    lora_alpha=32,           # Scaling factor
    target_modules=["q_proj", "v_proj"],  # Which layers to adapt
    lora_dropout=0.05,
    bias="none"
)
model = get_peft_model(model, lora_config)

# This model now has ~8M trainable parameters instead of 7B
# Training cost: hours on a single A100 GPU vs. weeks for full fine-tuning
model.print_trainable_parameters()
# Output: trainable params: 8,388,608 || all params: 3,752,071,168 || trainable%: 0.22%
You do not need to run this on your first week of the transition. Understanding what it does and being able to build toward it is the goal — and it is achievable within a 6-month structured learning plan.
The Portfolio Pivot: Reframing What You Have Already Built
Here is something nobody tells working analysts making this transition: your existing work is more reframeable than you think. The problem is not the work itself. It is how you are describing and presenting it.
The Reframing Principle
Every analytical project you have done as a Data Analyst contains the seeds of a Data Scientist project. The raw data, the business context, the domain understanding, and the stakeholder relationships are already there. What you add is the modelling layer and a reframed description.
Example 1: Sales Dashboard → Demand Forecasting Engine
Analyst description: "Built a monthly sales dashboard in Power BI showing revenue by product category, region, and salesperson, with YoY comparison."
Data Scientist reframe: "Built a demand forecasting system using a gradient boosting model trained on 36 months of historical sales data, seasonal indicators, and promotional calendar features — generating product-category-level 90-day demand forecasts with a MAPE of 8.4%, deployed as a scheduled Python job that updates the sales team's planning tool weekly."
The underlying data and business knowledge are the same. The addition is: a model (gradient boosting), a quantified evaluation metric (MAPE of 8.4%), a deployment story (scheduled Python job), and business impact framing (updating the planning tool). You are not fabricating anything — you are rebuilding the project with a predictive layer and describing the outcome precisely.
Example 2: Churn Analysis Dashboard → Customer Churn Prediction Agent
Analyst description: "Analysed customer churn patterns across product lines, identifying key drivers including inactivity period and support ticket frequency. Presented findings to the retention team."
Data Scientist reframe: "Developed a customer churn prediction system using a Random Forest classifier trained on 24 months of behavioural and transactional features, achieving AUC-ROC of 0.84 on a held-out test set. Integrated the model output with a LangChain agent that automatically segments at-risk customers by predicted LTV and generates personalised retention offer recommendations — reducing the retention team's daily triage time from 4 hours to 45 minutes."
Again: the same business knowledge, the same data. The additions are the model, the evaluation metric, and the agentic workflow extension that adds automation on top of prediction.
Example 3: Fraud Investigation Report → Fraud Detection Model
Analyst description: "Investigated 340 flagged transactions and identified patterns consistent with account takeover fraud. Produced a report with recommended rule updates for the fraud ops team."
Data Scientist reframe: "Trained an anomaly detection model on 18 months of transaction data, using DBSCAN to identify behavioural clusters and an Isolation Forest to flag transactions with unusually low density in the feature space. The model identifies account takeover patterns with 91% precision at a 3% false positive rate — an improvement over the existing rule-based system's 74% precision at 8% false positives. Deployed as a REST API endpoint integrated into the fraud ops triage queue."
The portfolio-building action plan:
- List your three most substantial analyst projects
- For each, identify: what was the underlying data? what was the business question? what was the decision it informed?
- Rebuild each project with a supervised or unsupervised model answering the predictive version of the same question
- Document the model choice, the evaluation metrics, and the deployment story — even if deployment is a simple Flask API on a free-tier cloud instance
- Rewrite the description in the scientist framing above
You will end a month of this work with three repositioned portfolio pieces that are honest, substantive, and dramatically more competitive than a standard analyst portfolio.
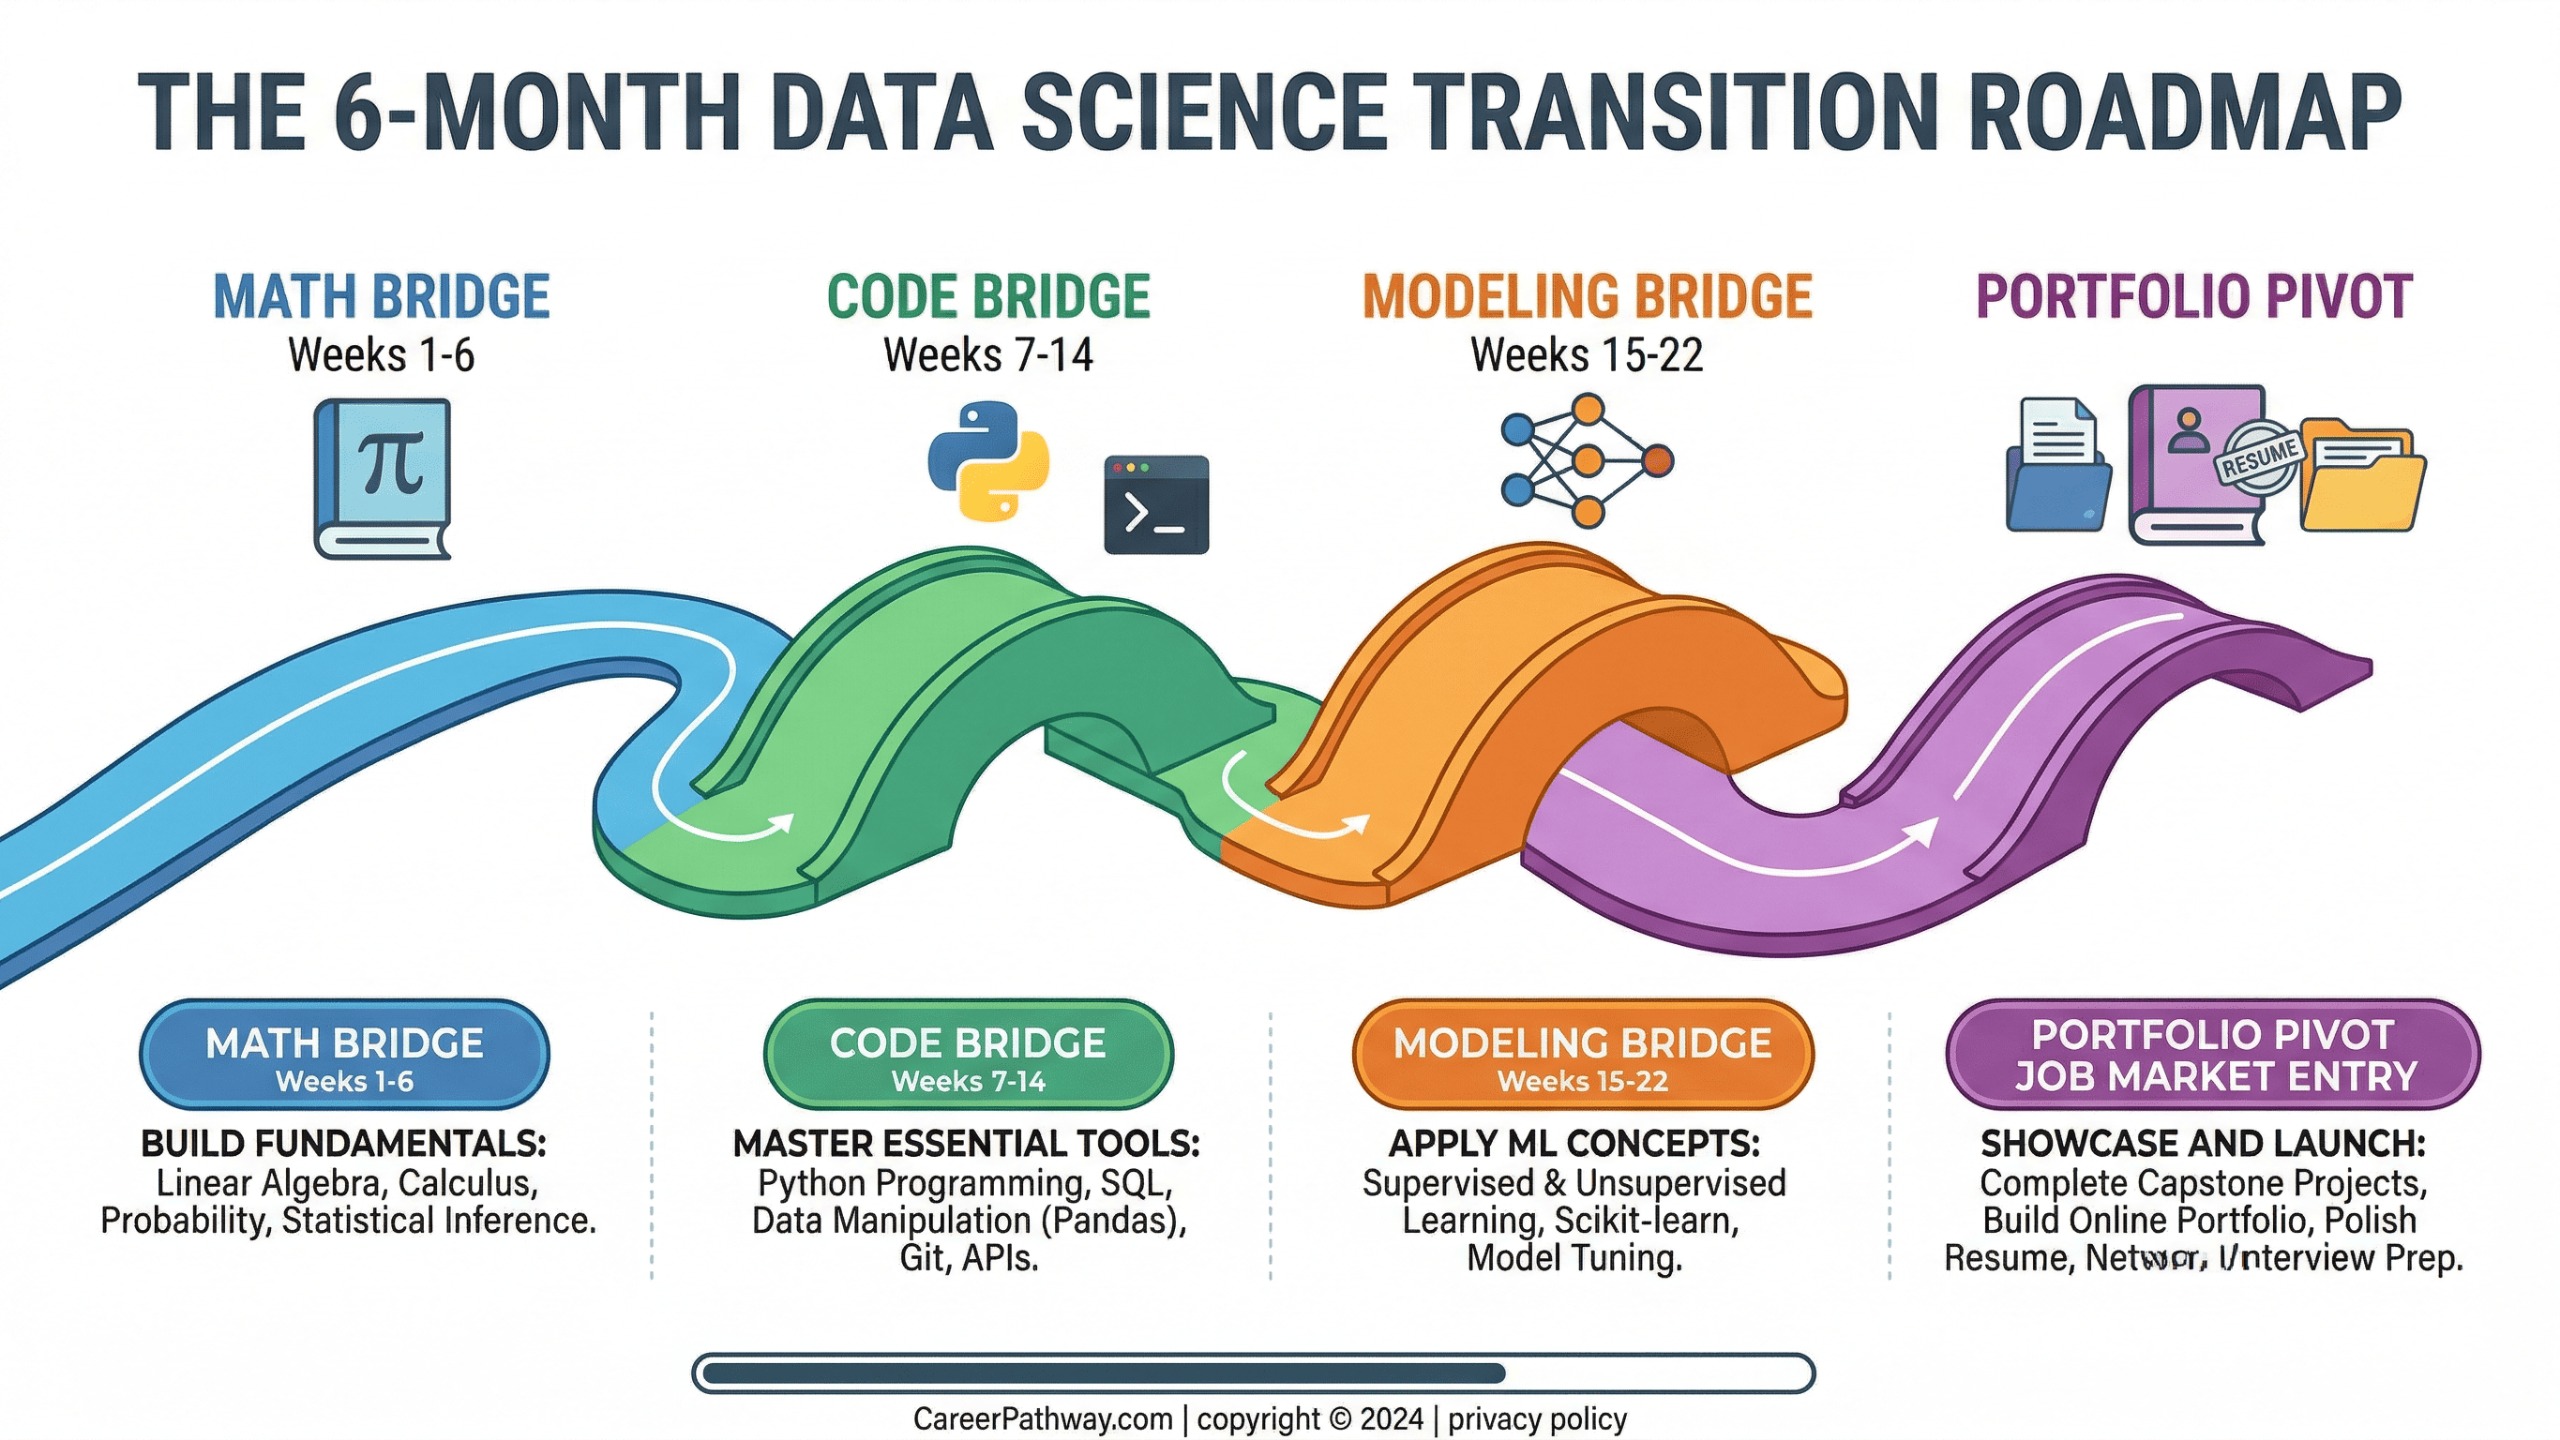
Upskilling for Data Science 2026: The 6-Month Transition Plan
This plan is designed for working analysts — people who have a job, a commute, and 1–2 hours per day to invest in the transition. It is not a full-time bootcamp schedule.
Phase 1 — The Math Bridge (Weeks 1–6)
Daily commitment: 60–90 minutes Focus: Linear algebra intuition, gradient descent, statistical inference
- Week 1–2: Khan Academy Linear Algebra (vectors, matrices, dot products, matrix multiplication)
- Week 3–4: 3Blue1Brown "Essence of Calculus" series, focused on derivatives and the chain rule as gradient descent foundations
- Week 5–6: Statistical Learning fundamentals — bias-variance trade-off, train/test split philosophy, cross-validation rationale
Milestone: Can explain in plain language why gradient descent works, what cross-validation is doing, and why standardising features matters for distance-based algorithms.
Phase 2 — The Code Bridge (Weeks 7–14)
Daily commitment: 90–120 minutes Focus: OOP in Python, scikit-learn Pipelines, PyTorch basics
- Week 7–8: Python OOP — classes, methods, inheritance,
__init__vs__call__. Rewrite one existing analyst script as a class. - Week 9–10: scikit-learn Pipelines end-to-end —
Pipeline,ColumnTransformer,GridSearchCV. Build one complete pipeline from raw data to cross-validated model. - Week 11–12: PyTorch tensors,
nn.Module, training loop from scratch on a simple classification task - Week 13–14: HuggingFace Transformers — load a pre-trained BERT model, fine-tune on a financial sentiment dataset using
TrainerAPI
Milestone: Can build a production-ready scikit-learn Pipeline for a structured ML problem and run a HuggingFace fine-tuning job end-to-end.
Phase 3 — The Modelling Bridge (Weeks 15–22)
Daily commitment: 90–120 minutes Focus: Supervised learning depth, unsupervised techniques, MLOps basics
- Week 15–16: Gradient boosting mastery — XGBoost and LightGBM, feature importance, SHAP values for explainability
- Week 17–18: Unsupervised learning — K-means, DBSCAN, Isolation Forest for anomaly detection, PCA for dimensionality reduction
- Week 19–20: Model deployment basics — FastAPI for model serving, Docker containerisation, deploying to a free-tier cloud instance
- Week 21–22: RAG pipeline fundamentals — LangChain, a vector database (ChromaDB), and a basic retrieval-augmented Q&A system using your domain data
Milestone: Three completed projects — one supervised (churn/credit prediction), one unsupervised (customer segmentation or anomaly detection), one GenAI (a RAG pipeline or fine-tuned classifier on domain data) — all with a deployment story.
Phase 4 — Portfolio Pivot and Market Entry (Weeks 23–26)
Daily commitment: 60–90 minutes Focus: Repositioning, LinkedIn, applications, interview preparation
- Week 23: Reframe existing analyst projects using the framework above. Update GitHub with clean, documented repositories.
- Week 24: LinkedIn overhaul — update headline to "Data Scientist | [Domain] | Python · ML · LLMs", rewrite the About section, add Featured projects
- Week 25: Begin applications to target roles. Apply to roles one tier above your current level — mid-level Data Scientist roles at FinTech and BFSI firms in Powai and BKC
- Week 26: Interview preparation — practice explaining your models' design choices, evaluation metrics, and business impact. Prepare for the standard Mumbai data science interview format: SQL test, Python coding challenge, ML case study, and stakeholder communication assessment
The Mumbai Market Outlook: What Waits on the Other Side
The salary data for this transition in Mumbai's 2026 market is unambiguous.
Data Analyst salary range in Mumbai: ₹8L–₹12L (1–4 years experience). The ceiling for an analyst who does not transition is approximately ₹18–22L as a Senior Analyst or Analytics Manager — a growth trajectory that typically takes 7–10 years to reach.
Data Scientist salary range in Mumbai: ₹18L–₹35L (entry to mid-level, 0–5 years post-transition). Senior Data Scientists at Mumbai's top FinTech and BFSI employers reach ₹35L–₹60L+. The 3-year post-transition trajectory routinely exceeds the 7-year analyst trajectory.
The transition premium: An analyst with 3 years of experience who successfully completes this transition typically enters their first Data Scientist role at ₹18L–₹24L — a 50–100% salary increase over their analyst compensation. At Year 3 post-transition, those who have added GenAI and MLOps skills are reaching ₹28L–₹40L.
The transition investment — 6 months of 1–2 hours daily — is one of the highest-return time investments available in Mumbai's 2026 tech market. The compound salary difference over a 10-year career between the analyst track and the scientist track, conservatively estimated, exceeds ₹3–5Cr in cumulative earnings.
Target employers for transitioning analysts in Mumbai:
- Fractal Analytics (BKC): Actively hires domain-experienced analysts making the transition. Values BFSI and retail domain knowledge alongside technical skills.
- HDFC Bank AI CoE (BKC): Banking domain expertise is a genuine competitive advantage for transitioning BFSI analysts. The fastest path in is demonstrating ML on banking-specific problems.
- Zepto and Groww (Powai): Fast-moving, equity-offering, open to non-traditional backgrounds. Value product intuition and GenAI fluency.
- Razorpay (BKC/Powai): Payments domain knowledge is scarce and valued. Analyst experience at a payments company is a strong differentiator.
- JP Morgan GCC (Vikhroli): The most competitive but highest-compensating. Requires the full package — technical depth, domain expertise, and polished communication.
The Most Common Mistakes in the Data Analyst to Data Scientist Career Switch
Mistake 1: Skipping the Math and Jumping to Libraries
The temptation to install scikit-learn on Day 1 and call GradientBoostingClassifier().fit(X_train, y_train) is understandable. The problem: when the model underperforms, you have no diagnostic tools. You cannot interpret the hyperparameters. You cannot explain to a risk committee why the model behaved the way it did on a specific segment. The math is not decoration — it is the operational knowledge that makes you a scientist rather than a library user.
Mistake 2: Stopping After the Certificate
Online certificates — Coursera, DataCamp, edX — are useful for structured learning but do not signal job-readiness to Mumbai's BFSI and FinTech employers. What signals job-readiness is a GitHub portfolio with real, deployed projects on real business problems. Every week you spend on certificates without parallel portfolio building is a week that does not improve your competitive position.
Mistake 3: Underselling the Analyst Experience
The most common portfolio mistake in this transition is treating Data Science as a fresh start — presenting only new ML projects and apologising for the analyst background. Your domain expertise, your business communication skills, and your experience with messy real-world data are competitive advantages. Frame your analyst experience as the foundation, not the limitation.
Mistake 4: Targeting the Wrong Role Level
Transitioning analysts frequently apply for entry-level Data Scientist positions — a reflex of modesty that is both unnecessary and counterproductive. With 2–4 years of analytical experience and the skill set built through this roadmap, you are competitive for mid-level Data Scientist positions. Applying to entry-level roles undersells your experience and often results in offers that barely exceed your current analyst salary.
Upskilling for Data Science 2026: Ready to Stop Reporting and Start Building?
The transition you are considering is not a reinvention. It is an evolution — a deliberate, structured upgrade of the skills, tools, and professional identity you have already been building. The domain knowledge, business instincts, and data intuition you have accumulated as an analyst are the foundation. The three bridges — Math, Code, Modelling — are what you add to stand on that foundation and reach the next level.
But the difference between understanding this roadmap and executing it is the difference between knowing the route to BKC and actually arriving there. Most working analysts who attempt this transition solo underestimate the time required to build genuine mathematical intuition, overestimate how much of the ML curriculum is relevant to Mumbai's specific job market, and stall at the portfolio stage — not for lack of skill but for lack of structure and feedback.
TechPaathshala's Data Science Transition Program is designed specifically for working analysts at exactly this career stage — 1–4 years of data experience, the ambition to make the scientist leap, and the need for a structured, placement-focused path that fits around a full-time job.
The programme gives you:
- A structured 6-month curriculum built around the three bridges above — with the Mumbai BFSI and FinTech job market as the north star, not a generic global data science syllabus
- Hands-on project building every week — not passive video lectures but code you write, models you train, and APIs you deploy, with instructor feedback at every stage
- The Portfolio Pivot workshop — a structured session where your existing analyst projects are collaboratively reframed into Data Scientist portfolio pieces that tell the right story to Mumbai's top employers
- Mumbai-specific interview preparation — SQL challenges, ML case studies, and the BFSI domain knowledge round that most transition candidates are underprepared for
- Placement support — résumé and LinkedIn optimisation, direct referrals to TechPaathshala's hiring network in BKC and Powai, and salary negotiation guidance calibrated to the ₹18L–₹35L target band
Ready to stop reporting and start building? Join TechPaathshala's Data Science Transition Program and get your personalised roadmap from analyst to scientist — designed for how Mumbai's market actually hires, and structured for how working professionals actually learn.
👉 Apply for TechPaathshala's Data Science Transition Program — your next performance review could reflect a completely different job title and salary bracket.
TechPaathshala is a Mumbai-based technology education platform helping data professionals make their most important career transitions — with programmes designed for the specific demands of Mumbai's 2026 financial and technology sector.